
Table of Contents
Trading Central Introduction
Trading Central is an organization that is providing market knowledge to brokers in 95 countries around the globe. It has been around for more than 15 years. The analytical platform is feature-rich and allows you to track a wide number of currency pairs, indexes, and commodities at the same time. Let’s do a quick Trading Central signals Review.
The program does not provide clear indications to enter the market; instead, it provides a complete analysis of the current situation, as well as a prediction and advice. How can a trader make use of the Trading Central platform’s features in his trading?
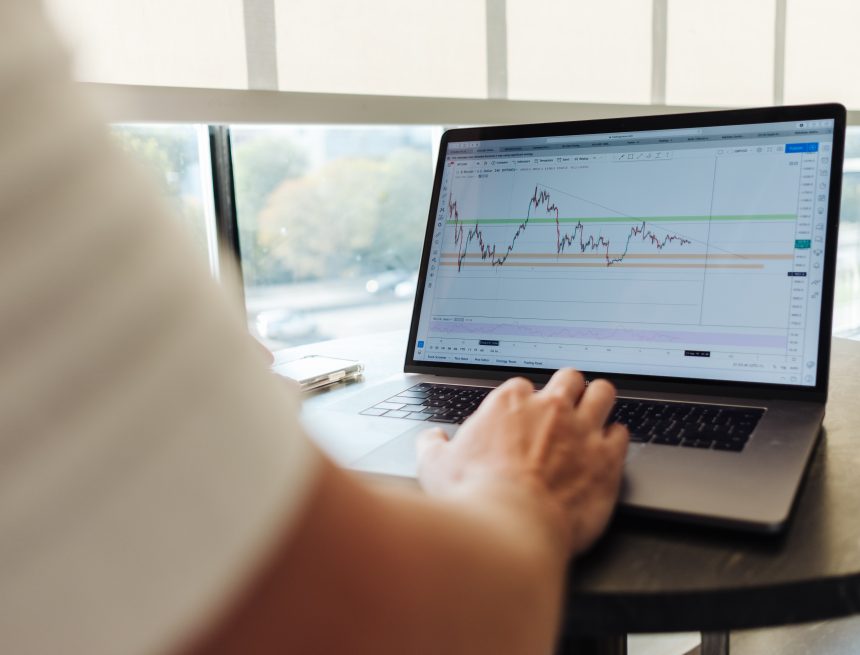
Trading Central signals review for MetaTrader 4
Install the Trading Central indicator in the same folder as the trading terminal after downloading it from the broker’s website. After that, it will display in the trading platform’s corresponding column. It should be dragged onto the currency pair chart.
In the indicator settings, you can alter the color of the lines and letters. The Trading Central analytical platform provides general recommendations for the direction of movement of the currency pair in the upper right corner. A description of the lines on the chart can be found in the lower left pane. The position on the currency pair market is described in detail on the right.
Trading Central – the Web version review
The Trading Central analytical platform for browsers is divided into three sections:
- Japanese candles;
- Technical analysis;
- Alarms;
Separate tabs offer information on indices, currencies, and raw resources. The “Technical Analysis” section includes information such as the last time the analytics for a financial instrument were updated, the current trend for the day and week, and the most recent price and its distance from the nearest support (column SOD1) and resistance (column SOP1) levels as a percentage of the indices.
The .”Alerts” block shows the signals of the .”Moving Average” indicators with periods of 20 and 50, their intersection, MACD readings, and the location of the RSI indicator line in relation to the levels of 30 and 70. The .
“Japanese candlestick” block displays the name of the candlestick pattern, its creation date, an opinion on future movement direction, and the price at which the alert is canceled. Each column has a filter at the bottom.
You can select one item from the list and click the magnifying glass button at the end of the line. The application will only provide you with information about the item you’ve chosen.
How to use Trading Central for Trading
A window with a chart and thorough analysis will emerge if you click on the line with the name of a financial instrument.
In two variants – the main and the alternative – the window on the left provides unambiguous suggestions regarding the development of the situation on the market of a currency pair, commodities, or indices. A chart of a financial instrument with BollingerBands, RSI, Moving Average indicators, support and resistance levels can be found on the right.
The prognosis for the movement of the currency pair is provided with an arrow for the convenience of users.
All previous reports on the financial instrument are a little lower. Every two hours or so, there will be a new update. You can get to the page of the analytical report for the time period indicated in the second column by clicking on one of them with your mouse. This data allows you to keep track of the changing situation on the foreign currency market.
If the market was in a downturn at the time of the report, a mark in the form of a red arrow appears in the right-hand columns (day, week, changes). In an uptrend, a green arrow appears. If the .”Change” column includes an equal sign, it signifies that the forecast has not changed since the prior report.
A huge list will mislead you and make your search harder if you’re trading one or more currency pairs. Add the instruments you want to your portfolio, and you’ll only see what you need on the list.
Conclusion
Trading Central’s analytics can be utilized as a confirmation signal to join the market in accordance with your trading plan. It is not advisable to adopt the advice without question.
The service was developed to help traders with technical analysis, not as a free trading signal platform. In a matter of minutes, the tool allows you to assess the market for a variety of financial products. The platform is ideal for those who are new to forecasting and lack the necessary experience.


+ There are no comments
Add yours